
Clustering Illusion – when randomness looks like a pattern
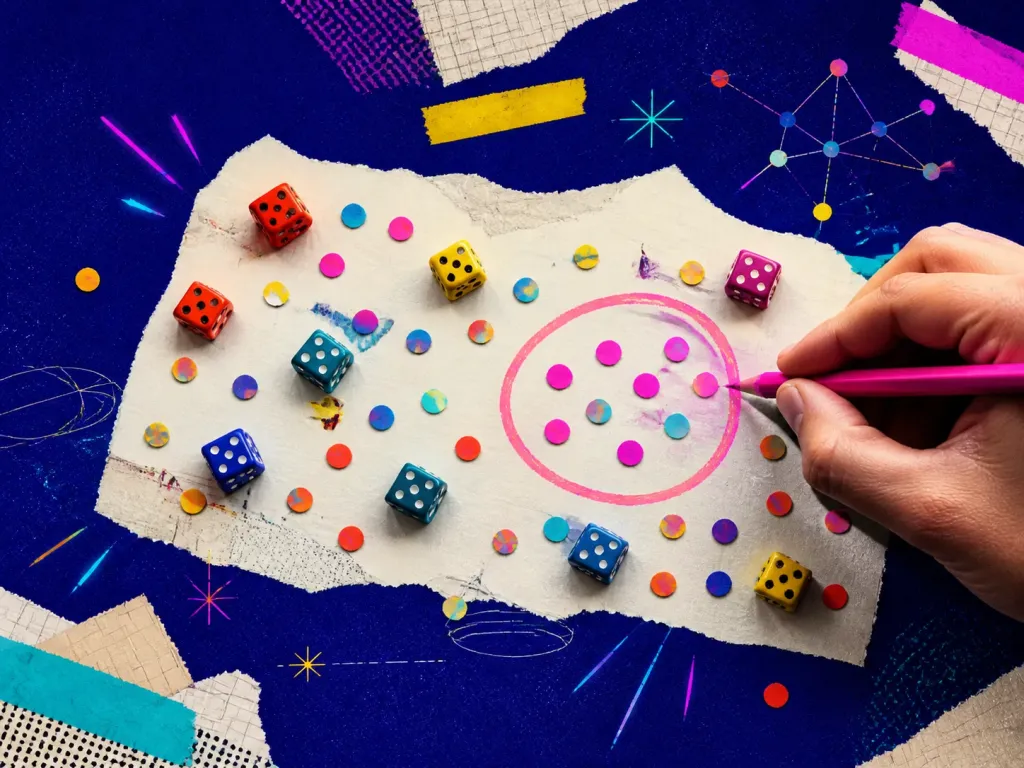
Do you see patterns where none exist? That’s Clustering Illusion – the tendency to overestimate the importance of small streaks, clusters, or runs in large sets of random data.
Examples and situations
- Gambling – three black numbers in roulette? You think red is ‘due’ next (it’s not).
- Stock market – believing you can ‘read’ chart patterns to predict movements.
- Sports – assuming a player is ‘on fire’ because of a lucky streak, even when it's just statistics.
Questions to check
- Understand randomness – streaks and patterns happen even without real meaning.
- Don’t rely on intuition in statistics – our brain sees patterns even when they don’t exist.
- Look at large datasets – isolated cases don’t prove a trend.
Long-form guide
Patterns in the Noise — Apophenia & the Clustering Illusion
That week wasn’t a special streak. It was just four random green builds clustered together. But it felt like a pattern. We tried to explain it. We built rituals around it. We stamped meaning into noise.
On this page
What Is The Clustering Illusion And Why Does It Matter?
Clustering illusion: when randomness looks like a pattern. That’s the whole trick. The clustering illusion is a cognitive bias where we perceive patterns in small samples of random data and conclude that the clusters (hot spots, streaks, pockets) mean something causal. Crisp definition: clustering illusion is our tendency to see meaningful clusters in random data, and then over-explain them. Why it matters: It distorts decisions. We double down on what “worked” last week, not noticing small numbers and luck; It invites superstition into strategy. We invent causes for clusters that don’t have one; It narrows exploration. We prematurely lock into a pattern and stop testing alternatives; It breaks our measurement. We treat random variance like signal and then overfit.
People fall for this at roulette tables and on trading floors, but also in product analytics, A/B tests, hiring, research, and relationships. The illusion flatters the storyteller inside us. It says, “Look! A pattern! You’re smart for noticing.” And we love being smart. A few classic research touchstones: Belief in the “law of small numbers.” We expect small samples to mirror the whole, which they don’t (Tversky & Kahneman, 1971); The “hot hand” fallacy. Players on streaks feel “hot,” but many streaks in sports are expected from random variation (Gilovich, Vallone, & Tversky, 1985); Coincidences feel rare; in fact, they’re common in large datasets (Diaconis & Mosteller, 1989); Runs of heads or tails in fair coins are not only common; their lengths grow with the number of flips (Feller, 1968). If you work with dashboards or code, beware: the clustering illusion is the UI bug in your brain.
1) The “Hot” Feature Release
We’re allergic to smug lectures. So here are human-sized examples where clusters fooled real people (including us). We shipped a micro-improvement to onboarding copy—two sentences, one emoji. Signups jumped for three days. Slack lit up: “The copy change worked!” We started drafting follow-ups to milk the win.
Then the trend reverted. What happened? Saturday. Our spike coincided with a weekend shout-out from a small influencer in a niche dev community. The cluster landed near our change, so we gave our words credit. Randomness photobombed our narrative. Takeaway: short windows lie. Check longer baselines and external noise.
3) The “Bad Batch” Of Customers
We tested three CTA colors over a week. Red beat blue by 10%. High fives. We moved everything to red. Six weeks later, aggregate data showed no reliable difference. Why the early win? A few big accounts clicked during the red variant window—a cluster of heavy users compressed into one week. The effect evaporated at scale. Takeaway: heavy-tailed user behavior can cluster clicks. Weight your data. Run longer.
Two clients churned in one month with similar feedback: “Too complex.” We scrambled to simplify features. Then the next five customers praised flexibility. The churn cluster misled us. The two clients came from the same small referral circle with similar needs. Not a global truth. Just a local patch. Takeaway: clusters in a segment are not universal. Segment before generalizing.
5) The Startup “Luck Aura”
A local city map showed more accidents at a certain junction. People demanded speed bumps. A traffic analyst plotted incidents per vehicle mile traveled. When accounting for traffic volume, the intersection wasn’t unusual. High-flow roads create visible clusters by chance. The fix, if any, belonged elsewhere. Takeaway: normalize by exposure. More traffic means more events—even with the same underlying rate.
A VC swears a certain partner is a talent magnet because three of their last five hires became standout performers. Later, we notice two less-visible hires struggling. Our view had focused on the cluster of stars—availability and survivorship at work. The halo was a mirage. Takeaway: clusters often reflect where we point the spotlight, not where the light should be.
7) The Country With “Miraculous” Cancer Clusters
Two critical bugs surface in back-to-back sprints from the same engineer’s code. People whisper about quality. We run a code review across six months. Their overall defect rate matches the team average. Two bugs clustered. The story “always” was born from two datapoints and some stress. Takeaway: count across time. Fear loves clusters. Several neighborhoods report cancer clusters. The press demands answers. Epidemiologists warn: when many regions exist, some will show high counts by chance alone (Diaconis & Mosteller, 1989). Some clusters merit investigation, but the presence of a cluster doesn’t prove a cause.
Takeaway: bunching happens in any large field of random events. We once had two weeks where cold emails from our .io domain converted better than the same copy sent from .com. Was .io “more credible?” We built theories. Then we discovered our .com sender reputation had dipped for a few days; our email service throttled deliverability. In other words, a random operational blip, not a brand perception pattern. Takeaway: clusters often mask operational noise. Verify the plumbing.
Habits That Keep You Honest
Pre‑commit to analysis plans. Write down what you’ll measure and how long you’ll run it before you start. Even a paragraph in a notebook helps. Use confidence intervals, not just point estimates. Teach your team to read ranges. Visualize simulations. Simulate random processes and see how often streaks happen. Nothing cures illusions like watching chance produce dramatic patterns.
Track base rates. Keep a plain‑text doc with historical metrics. Include typical ranges. Name your assumptions in public. “We think this is real because X; we might be wrong because Y.” It invites better scrutiny. Rotate skeptics. Assign a weekly “designated doubter” role. Their job is to challenge the pattern narrative.
Clustering Illusion vs. Apophenia
Statistical notebooks (R/Python) with bootstrapping templates. Sequential testing frameworks with proper error control. Randomization checks across A/B groups. Anomaly detection with backtesting against synthetic null data. Lightweight experiment registries (even a shared spreadsheet). We bake variations of these into our Cognitive Biases app because the best time to stop a myth is the first minute it shows up.
Biases travel in packs. Here’s the short tour of nearby phenomena. Clustering illusion: mis‑seeing patterns specifically in random data clusters. Apophenia: the broader tendency to perceive connections or meaning in unrelated things—hearing messages in static, seeing faces in clouds. Clustering illusion is apophenia’s data‑analytics cousin.
Clustering Illusion vs. Hot Hand
Clustering illusion: “Look, a cluster—there must be a cause.” Gambler’s fallacy: “After five reds, black is due.” One over‑explains clusters; the other expects random events to self‑correct. Both misunderstand independence (Tversky & Kahneman, 1971; Arkes & Hammond, 1986). Hot hand: a person in a streak will continue to perform better because they’re “hot.”
Historically, many streaks are random (Gilovich, Vallone, & Tversky, 1985). Newer work finds small, context‑specific hot hand effects but much weaker than intuition suggests. Key difference: hot hand adds a psychological cause to performance streaks. Clustering illusion is the generator of streaks in the noise.
Clustering Illusion vs. Overfitting
Clustering illusion: you see a pattern because random clusters fool your eye. Confirmation bias: you favor evidence that supports your belief. They often collude. You notice a cluster that supports your theory and ignore clusters that contradict it. Texas sharpshooter: you shoot at a barn, then paint the target around the bullet holes. In data terms: you define your hypothesis after seeing the data cluster.
Clustering illusion tells you the holes form a bullseye. Texas sharpshooter is the act of pretending that was your target all along. Overfitting: a model learns noise from training data and fails on new data. Clustering illusion: the human version of overfitting by eye. If you wouldn’t ship a model that memorizes noise, don’t ship a story that does.
Engineering Reliability: Clustering Illusion
Here are scenarios you might recognize from your world, and what to do about them. You see a heatmap with hot spots around a new button. Before you celebrate, check scroll depth and viewport changes. Heatmaps can cluster where users rest their cursor, not where they engage. Daily active users spike every Monday. Before anointing “Motivation Monday,” plot the last 12 weeks. Weekday cycles cluster. What to do: smooth with a 7‑day rolling average, compare week‑over‑week, and annotate releases and promotions on your charts.
Error rates cluster around certain hours. Could be cron jobs, backups, or regional traffic shifts. Two outages happened after deploying service X. Easy to blame X. But check overall deployment counts. If you deploy X more often, incidents will cluster near it by exposure alone. What to do: normalize incidents by deployments and traffic. Run postmortems with “5 Whys,” not “1 Cluster.”
People & Hiring: Clustering Illusion
A subset of ads converts like wildfire for three days. Meanwhile, your budget algorithm doubles down. You now have an expensive hunch. One influencer “drives the best users.” Define “best,” then run a matched cohort analysis to control for timing and pricing. What to do: set cool‑down periods, cap automated spend on early spikes, and split‑test sources over longer windows. Two bad interviews in a row from a specific university. Don’t blacklist a school. That’s two datapoints.
A referral source “always” sends stars. Check performance over 12 months. Remember survivorship—referrals sometimes get more support. What to do: set hiring bar metrics, track pass‑through rates, and commit to n‑sized samples before declaring trends. A town notes three rare diagnoses on a street, seeks environmental causes. Investigate with care. But remember: in a nation of millions, many such clusters will appear randomly (Diaconis & Mosteller, 1989).
Airline incidents cluster in summer. Is it weather, traffic volume, or reporting bias? What to do: compare to exposure. Use Bayesian priors. Be humble with small n. We practice seeing randomness correctly like you practice scales on a guitar. Run these quick drills to reset intuition and de‑glamorize streaks.
What Random Really Looks Like (Spoiler: Clumpy)
We expect randomness to alternate nicely: heads, tails, heads, tails. But a truly random process clumps. You get bunches. If your random scatterplot looks too evenly spaced, it’s probably not random. Designers of lotteries and password generators learned this the hard way. In the early iPod Shuffle days, users complained the algorithm wasn’t random because songs sometimes repeated.
Apple made it “less random” by adding rules to avoid repeats so it felt more random. In other words, they added anti‑clustering logic to appease human expectations. This mismatch between true randomness (clumpy) and our intuition (smooth) is the root of the illusion. Once you internalize that “clumpy is normal,” you stop inventing stories every time dots huddle together.
The Psychology Under The Hood
A quick tour under the brain’s hood—not academic fluff, just the useful parts. Pattern hunger. Brains evolved to predict. Seeing patterns early kept us alive. The cost of false alarms is low compared to missing a real pattern; Small-number syndrome. We feel that small samples should look like the whole (Tversky & Kahneman, 1971). They don’t. Small samples are noisy; Narrative glue. Stories stitch scattered events into coherent arcs.
Clusters provide easy story seeds; Salience bias. Clusters are visually striking. Our attention hikes to them, while sparse areas feel boring and “normal.” Control craving. Clusters lull us into thinking we understand and can control outcomes. It hurts to say, “We don’t know yet.” Knowing the machinery doesn’t stop the bias, but it makes you respectful of your own brain: a brilliant storyteller that needs a statistician co‑pilot.
How We Bake This Into Our Workflows
We don’t fight bias with willpower. We redesign the environment. Dashboards with baselines: every chart includes 3–6 month ranges and confidence bands; Alerts with context: anomaly alerts force an external‑event checklist before anyone posts a hot take; Default longer tests: our AB platform uses minimum sample sizes and fixed windows unless explicitly overridden; Weekly “What fooled us?” review: we share a moment from the week where noise mimicked pattern. Celebrate the catch; Sandbox for simulations: a repo with ready‑to‑run notebooks: runs analysis, bootstrap CI, null shuffles; Decision memos: one section titled “Randomness reality check,” with three bullets: sample size, exposure, multiple comparisons.
We’re wiring these into our Cognitive Biases app so teams can run a quick “illusion lint” on their conclusions before they ship them to production brains. Clusters happen in random data. Expect streaks. Small samples lie loudly; longer baselines whisper the truth. Normalize by exposure. Per‑X rates beat raw counts. Pre‑register metrics and windows. Don’t paint targets around bullet holes. Simulate the null. If randomness can produce your pattern often, you don’t have a pattern yet.
A Short Walk Back To The Bell
We still have the brass cat bell. We ring it for actual achievements now: tests that close with power, launches that beat a pre‑registered goal, rescues that fix root causes. The bell rings less often, but each ring means something. The clustering illusion isn’t a villain. It’s a side effect of a beautiful thing: our craving for patterns. That craving builds art and science and code. But it needs a companion—a humble respect for chance.
So the next time a cluster winks at you—a sudden spike, a “hot” streak, a scary pair of failures—try this: Breathe. Pull your baseline. Normalize by exposure. Simulate the null. Decide proportional to the cost of error. If the pattern survives those steps, maybe you found a real signal. If it fades, you just saved your team from chasing a ghost. Either way, ring the bell. Not for luck. For clarity. For the small, stubborn discipline of seeing the world as it is and still making something wonderful out of it.
Arkes, H. R., & Hammond, K. R. (1986). Judgment and Decision Making. Diaconis, P., & Mosteller, F. (1989). Methods for Studying Coincidences. Feller, W. (1968). An Introduction to Probability Theory and Its Applications. Gilovich, T., Vallone, R., & Tversky, A. (1985). The Hot Hand in Basketball. Tversky, A., & Kahneman, D. (1971). Belief in the Law of Small Numbers.
Decision checklist
- Sample size
- Time window
- Baseline vs. variance
- Normalize by exposure
- Segment sanity
- Multiple comparisons
- Randomization check
- Effect size
- External events
- Runs & streaks
- Replication
- Stop rules