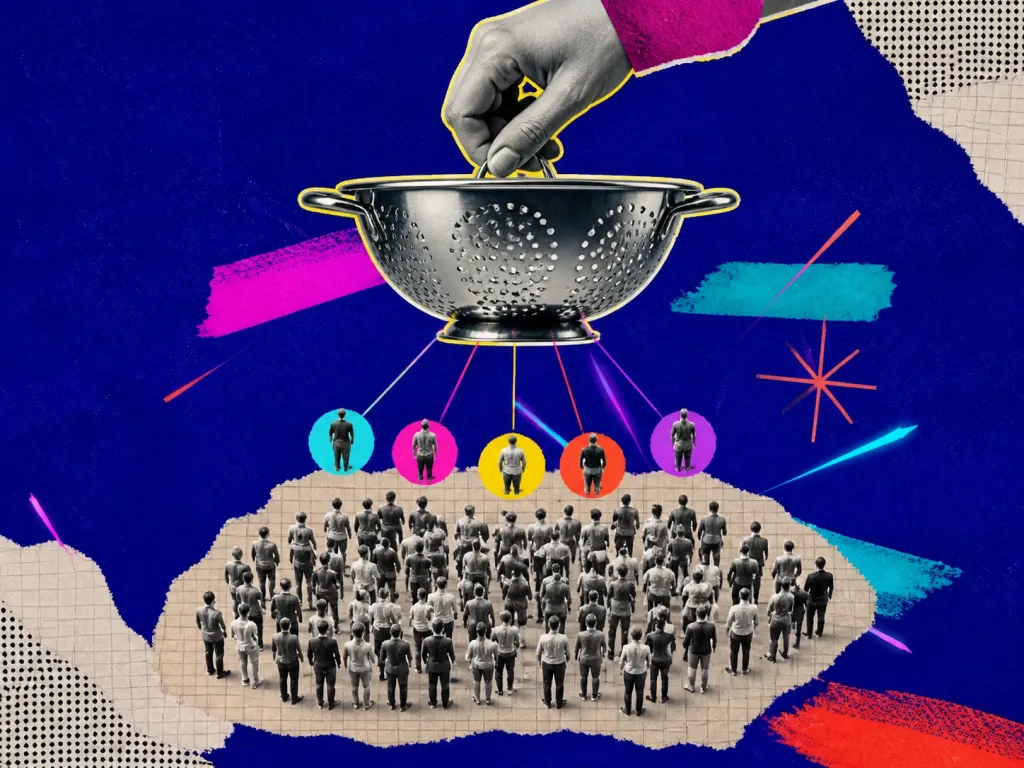
Illusion of Validity – when you think your judgments are more accurate than they are
Do you believe your judgments are accurate just because the available information fits together well? That’s Illusion of Validity – the tendency to overestimate the accuracy of one’s judgments, especially when data appears logically consistent.

Examples and situations
- Finance – an investor assumes their market predictions are correct because past guesses were right.
- Career – an HR manager believes they can perfectly identify top candidates, ignoring past hiring mistakes.
- Logic – if multiple facts form a coherent story, it feels true, even if it’s just a coincidence.
Questions to check
- Don’t confuse coherence with accuracy – even the most logical scenarios can be wrong.
- Look for validation beyond your own logic – check the data, not just your intuition.
- Allow room for error – if you feel 100% certain, chances are you’re overlooking something.
Long-form guide
The Quiet Confidence Trap: How the Illusion of Validity Tricks Smart People
You’re standing at the whiteboard, pen tapping a rhythm against the cap. The team looks to you for the call: greenlight the feature or hold the line. You’ve reviewed the user interviews, skimmed the analytics, and glanced at three competitor tear-downs. The pattern feels obvious. You feel it in your bones—the compelling, almost magnetic pull of a clean narrative forming. You make the call.
On this page
What is the Illusion of Validity and why it matters
It feels right. Clean. Certain. Valid. Two months later, the feature moves numbers, but not the numbers you thought. Your “sure thing” was a maybe, and the pattern you saw was the kind of constellation humans invent out of scattered dots. Not wrong, exactly. Just overconfident. That quiet confidence was the trap. The Illusion of Validity is the feeling that your judgment is more accurate than it really is. The Illusion of Validity shows up when your confidence in a decision or prediction outruns the actual accuracy of the information and method you used. It’s the uncanny sensation of “this adds up” even when the inputs are thin, noisy, or cherry-picked.
Psychologists Daniel Kahneman and Amos Tversky described it plainly: even when evidence is limited and patterns are weak, we can feel deeply certain that our judgments are correct (Kahneman & Tversky, 1973). Confidence becomes a vibe, detached from what’s true. We over-read coherence. We underweight base rates. We love a good story. Why does this matter? Because confidence persuades. It hires candidates, funds projects, moves money, ships features, and fuels wars. When confidence outpaces accuracy, organizations misallocate attention and resources. Individuals burn time and trust. Teams get noisier—different people, different days, different calls (Kahneman, Sibony, & Sunstein, 2021). The cost isn’t just wrong decisions; it’s the compounding of small errors over time.
What makes this illusion seductive: Patterns feel real. Our brains are pattern-making machines. Representativeness—that instinct to match cases to prototypes—can dominate the math; Coherent stories feel like truth. When evidence lines up neatly, we mistake fluency for validity; Feedback is delayed or fuzzy. If you don’t keep score, your brain will happily assume it’s winning; Prestige and experience can harden the illusion. Experts also suffer from it; sometimes more, because they see more patterns. Your gut is not the enemy. It’s just very convincing, and not always calibrated.
1) The hiring round that felt obvious
We’ve seen it across products, engineering, investing, and daily life. These aren’t fables. They’re the texture of real work. A startup CTO interviews six engineers in a week. One candidate is electric. Fast answers. Shares the same tech stack history. Charming. The CTO’s mental model clicks into place: “They’re exactly like our best dev.”
Outcome: Three months in, the hire struggles with legacy code and teamwork. They’re brilliant in single-player mode but flounder in cross-functional work; Postmortem: The CTO overweighted the “prototype match” and interview fluency, underweighted structured signals. Representativeness + fluency = confident call, weak validity. Meehl found structured, actuarial approaches outperformed unstructured judgments decades ago (Meehl, 1954).
3) The investor who did their “deep work”
Growth lead notices a retention dip in one cohort and a spike in another right after a new onboarding tweak. The curve tells a story: onboarding change drove retention. Slides appear. The sprint shifts. Outcome: Subsequent cohorts don’t replicate the bump. The initial spike was seasonality and a partial rollout to a segment with higher prior activity; Postmortem: The story felt tight. The data “proved” it. But the base rates and controls were thin. Confidence soared. Validity, not so much.
An angel investor reads three long memos and two Twitter threads on a buzzy AI startup. The hot take feels strangely inevitable: “They’ve cracked distribution.” It threads together: founder pedigree, partnerships, beta testimonials. Outcome: A year later, churn quietly eats LTV. The partnerships were press releases, not pipelines; Postmortem: The story featured familiar cues. Selective evidence looked coherent. But coherence isn’t causality.
5) Forecasts by vibe
Senior engineer gives a confident 3-week estimate. The logic is sound: similar feature, similar scope, similar stack. Feels right. Outcome: 9 weeks, three unexpected migrations, and two integration gremlins later, the feature ships; Postmortem: Planning fallacy strikes again. Inside view dominated. The team trusted the confident analogies over the reference class of how long similar features actually took (Kahneman & Lovallo, 1993). A marketing lead, seasoned and savvy, predicts: “This channel will pay back in 45 days; it always does.” Voice steady. Numbers crisp. Outcome: Payback doubles. The audience shifted; the creative fatigued faster; CPMs rose; Postmortem: The illusion thrives when yesterday’s pattern is applied to today’s changed conditions without asking: what’s really the same?.
You once had a headache on a day you didn’t drink coffee. Today you’ve got a headache. The coffee narrative slides into place: obvious cause. You hydrate and suffer through a day you should have spent addressing sleep or stress. Outcome: You misattribute cause and reinforce a false rule; Postmortem: Single-case coherence creates unwarranted certainty.
Recognize the illusion: early warning signs
When you catch yourself thinking, “This just makes sense,” pause. Sense-making is partly guesswork. Signals to watch: The narrative clicks too cleanly, too fast; Your confidence stays high even when you can’t specify base rates or failure modes; You can’t name what would change your mind; Most of your evidence is qualitative, recent, or anecdotal—and still, you feel sure;
You rely on expert consensus without looking at their track record; The decision matches your identity story—“we’re the kind of team that ships fast”—and you feel righteous; The feedback loop is long or easily rationalized after the fact. A reliable meta-signal: if articulating the counter-argument feels annoying or beneath you, the illusion might be driving.
Step 1: Square up to base rates
Here’s a practical system we use with ourselves and teams we advise. It’s not fancy. It’s repeatable. Start with the outside view. Ask: In the reference class of similar projects, what typically happened? How long did it take? What success rate? Use memory lightly; pull actual numbers; If you don’t have a reference class, build a quick one.
Three comparable cases beat zero; Weight base rates before sprinkling in story-specific factors (Kahneman & Tversky, 1973; Kahneman & Lovallo, 1993). Example: For a new feature, check your last ten features of similar scope: time-to-ship, impact on primary metric, bugs introduced, rework. Use the median as your anchor, not your feeling.
Step 3: Commit to a forecast and a score
Replace binary predictions with probabilities. Not “will succeed,” but “60% chance of hitting +5% retention by day 30.”; Write down the conditions. What must be true for this to work? What breaks it?; Use ranges for estimates. Give P50 and P90. “50% chance by March 15; 90% by April 12.”. This simple move reduces the seduction of tidy stories and lets you calibrate over time (Lichtenstein, Fischhoff, & Phillips, 1982).
Before acting, log your forecast and rationale. Timestamp it; Define the scoring rule. Brier score for categorical outcomes; absolute percentage error for estimates; Review monthly. Score yourself gently but honestly. Patterns appear fast when you keep score. Forecasting improves most when the loop closes (Tetlock, 2005).
Step 5: Structure the judgment
Gather the team. Imagine it’s six months later and the project failed badly; Ask everyone to write down three reasons it failed. Quiet first, then share (Klein, 2007); Surface assumptions you were previously blind to. Adjust plan, add tripwires. Pre-mortems create sanctioned pessimism to balance the glow of coherence. For hiring: use structured interviews with standardized questions and anchored rubrics.
Blind work samples where feasible. Aggregate scores; For product: list key hypotheses, design small tests, predefine success criteria. Move from “feels right” to “tested right.” For code estimates: reference historical velocity, add buffers based on the P90 of comparable tasks, and explicitly account for integration risks. Meehl’s research showed that simple linear models and structured methods often beat human intuition (Meehl, 1954; Dawes, 1979).
Step 7: Shrink the bet, shorten the loop
Assign a teammate to argue the other side. Give them time and data. Their job isn’t to be a contrarian caricature; it’s to build the strongest challenge; Reward the countercase. Make it normal to praise the person who talked you out of a bad bet. A good red team softens the grip of “I just know.” Turn one big bet into multiple small ones. Ship a slice. Run an A/B test. Soft launch in a smaller market; You don’t need to be less bold. You need more reversible moves.
It’s okay to act with uncertainty. Commit knowing you might be wrong. Write the confidence level next to the decision, not inside it; If you must move with a shaky forecast, add monitoring and checkpoints. Threats feel smaller when you’ve built exits. If you can’t check at least seven, the illusion is probably whispering.
Related concepts people mix up (and how to tell them apart)
The Illusion of Validity sits in a crowded neighborhood. Here’s your quick map. Overconfidence bias: A bigger umbrella. Being more confident than accurate in general. Illusion of validity is a specific flavor: the seductive feeling of correctness when evidence looks coherent but isn’t strong (Kahneman & Tversky, 1973); Representativeness heuristic: We judge by similarity—“this candidate fits the prototype.” It feeds the illusion by making tidy matches feel accurate, regardless of base rates; Confirmation bias: Seeking evidence that confirms your view. With illusion of validity, you might not even seek—your brain auto-composes coherence; Hindsight bias: After outcomes, we feel “I knew it all along.” It repairs the illusion by rewriting the past to fit the present (Fischhoff, 1975);
Dunning–Kruger effect: The least skilled overestimate performance due to metacognitive limits (Kruger & Dunning, 1999). Illusion of validity hits all skill levels; experts can be very confident and still wrong; Anchoring: The first number or idea pulls your estimate. Anchors often seed a seemingly valid story that you then defend; Survivorship bias: You only see winners, so you misjudge odds. It inflates the perceived validity of strategies you can observe; Noise: Random variability in human judgment across people or time. Illusion of validity masks noise by making each noisy judgment feel reasonable (Kahneman, Sibony, & Sunstein, 2021); Planning fallacy: Underestimating time/cost. It’s often the illusion in timeline clothing. If you feel clarity and speed brushing your cheeks, check which neighbor you just walked past.
Calibrate with Brier scores
Here are practices we’ve seen stick inside product teams, research groups, and small funds. Each significant decision gets a one-page entry: context, options, chosen path, forecast with probabilities, key assumptions, kill criteria; Quick to scan, easy to score later. You’ll spot your personal illusions—some people over-believe stories from authority;
others over-believe patterns in “their” domain. For binary outcomes, rate your probability and, when outcomes arrive, compute the Brier score. Lower is better. Post a small scoreboard; You don’t need to gamify it. Seeing the numbers grounds your inner narrator.
Pre-commit to tripwires
Each week, one person is the “calibration partner.” Their job: ask “base rate?” and “what would change your mind?” on the top two decisions; Make it social and light. No performance theater. Build a shared library: “New feature time-to-impact: past 12 launches,” “Hiring success by source,” “Vendor integrations: P50/P90 time.”; When the question is “what usually happens,” don’t debate—pull the card. Define clear conditions to pause, pivot, or kill a project. Example: “If D30 retention doesn’t move by at least 2% after two iteration cycles, we stop.” Write it down before the glow of commitment floods your brain.
When you get it wrong, write a two-paragraph “lessons learned”—what I believed, what happened, what I’ll change. Share it. Reward it; When you get it right, still score your calibration. Were you right for the right reasons?. For big calls, run a quick, anonymous poll with probabilities among the team. Aggregate. The wisdom of crowds isn’t magic, but it blunts individual illusions. Build the habit: outside view first, inside view second. Even a ten-minute outside view beats a vibe.
A walk through a practical example
Let’s say your team wants to launch a “starter plan” to capture price-sensitive users. The deck is persuasive. Your growth lead is confident. Do this instead: Pull last three pricing changes. Did they move signups? CAC? Churn? Revenue per user?; Gather two competitor cases where a low-tier plan was introduced. What happened to upgrade rates?. 1) Base rate snapshot Define the target: “We expect a 15–25% increase in signups and a net +3–5% revenue after 90 days.”; Write confidence: “We are 60% confident of hitting the lower bound.”. 2) Forecast with ranges
Why it might fail: cannibalization, support load explodes, payment friction increases, price anchors expectations across segments. 3) Pre-mortem Kill if ARPU drops >8% by day 45 without compensating volume; Pause if support tickets per user double. 4) Tripwires Soft launch to 20% of traffic. A/B test. Monitor. 5) Small-bet structure Set the review for day 45 and day 90. Score forecasts. Write a short retrospective. 6) Scoring and review Notice what happened: you kept the narrative, but you forced it through a test-fit. The illusion loses its edge when it meets structure.
Why your brain loves the illusion (and how to love it back)
This isn’t a moral failing. It’s an adaptation. Fast pattern-recognition keeps us alive. Coherent stories compress the world so we can act. The problem is the mismatch: modern work is full of open systems, delayed feedback, and messy causality. Our intuitive certainty was tuned for a simpler environment.
What helps: Respect your intuitions for what they are—hypothesis generators; Build a culture where changing your mind is a flex, not a flaw; Find joy in calibration. It’s not cold. It’s actually generous: you’re spending less of your team’s life on avoidable error.
Research corner, light and useful
Kahneman & Tversky (1973): Showed how representativeness and the desire for coherent stories create the Illusion of Validity, especially when base rates are ignored; Meehl (1954): Demonstrated that simple actuarial models often outperform expert clinical judgments. Structure beats vibes; Dawes (1979): “The robust beauty of improper linear models” — even simple equal-weight models can beat expert intuition; Lichtenstein, Fischhoff, & Phillips (1982): Documented systematic overconfidence and the value of calibration exercises;
Kahneman & Lovallo (1993): Introduced reference class forecasting to fight planning fallacy—outside view first; Tetlock (2005): Found that expert political judgments were often poor; fox-like thinkers with probabilistic habits did better; Klein (2007): Popularized the pre-mortem, a practical tool to counter optimistic coherence; Kahneman, Sibony, & Sunstein (2021): Showed that “noise” (random variability in judgments) is pervasive; structure and aggregation reduce it. You don’t need to memorize these. Just build their spirit into your workflow.
Wrap-up: make confidence earn its keep
The Illusion of Validity feels like clarity. It’s a warm light. It makes us brave. Keep the bravery. Tie it to scaffolding. Ask for base rates. Forecast, then score. Invite the counter-story. Shrink the bet. This is how teams keep their edge without slicing themselves.
We write about these topics because we keep tripping on them ourselves—and because we’re building Cognitive Biases to put bias-spotting and calibration tools where decisions actually happen. We want you to trust your voice, but also to make it prove itself. Your future self will thank you.
Decision checklist
- [x] Did we articulate the base rate for similar decisions?
- [x] Did we write a probabilistic forecast (with a range) and timestamp it?
- [x] Did we list the top three assumptions that must hold true?
- [x] Did we run a 15-minute pre-mortem and capture failure modes?
- [x] Did we define how we’ll score the outcome and when we’ll review it?
- [x] Did we structure the evaluation (rubrics, work samples, predefined metrics)?
- [x] Did someone build the strongest counter-argument?
- [x] Did we shrink the bet or shorten the feedback loop where possible?
- [x] Do we know what new evidence would change our mind?
- [x] Did we separate confidence level from decision urgency?